
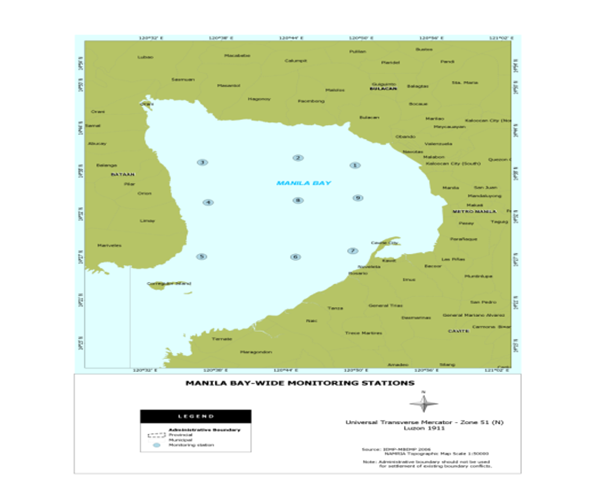
Nine (9) stations Baywide in Manila Bay as shown in figure 2 were monitored for DO, pH, salinity, phosphate, temperature and conductivity.
A decreasing trend of Dissolve Oxygen (DO) from top to bottom was observed in the bay. Except station 7 that was monitored in 2011, surface DO conformed the criteria of 5 mg/ml in all stations from 2011 to 2015.
High levels of pH ranging from 9.62 to 8.36 were observed in the bay. Potential Hydrogen values are affected by the excess hydrogen H+ present in sea water. This excess hydrogen is affected by the Carbon cycles in photosynthetic activities by phytoplankton and algae.
The high pH value attributed to Photosynthetic action by phytoplankton and photosynthetic microorganisms since they have to break down carbonate ions consuming free hydrogen ions into aqueous Carbon dioxide and water.
Table 4 – Result of Comparative Baywide Monitoring for DO from 2011 – 2015
| STATION | 2011 | 2012 | 2013 | 2014 | 2015 |
| DO mg/L | DO mg/L | DO mg/L | DO mg/L | DO mg/L | |
| 1 | |||||
| Surface | 6.69 | 9.52 | 8.57 | 8.89 | 15.82 |
| Mid | 6.59 | 2.07 | 6.89 | 7.13 | 5.73 |
| Bottom | 2.34 | 1.89 | 3.63 | 2.4 | 3.36 |
| 2 | |||||
| Surface | 6.63 | 8.03 | 8.79 | 7.78 | 10.88 |
| Mid | 5.2 | 3.41 | 7.46 | 3.1 | 4.98 |
| Bottom | 1.66 | 1.63 | 4.73 | 3.06 | 1.56 |
| 3 | |||||
| Surface | 7.66 | 9.3 | 10.77 | 7.72 | 8.98 |
| Mid | 5.12 | 3.29 | 6.85 | 7.4 | 5.07 |
| Bottom | 6.33 | 1.68 | 5.84 | 7.36 | 3.16 |
| 4 | |||||
| Surface | – | 11.68 | 9.61 | 7.67 | 8.93 |
| Mid | – | 4.43 | 7.84 | 4.21 | 2.87 |
| Bottom | – | 2.2 | 6.39 | 2.86 | 2.7 |
| 5 | |||||
| Surface | – | 9.84 | 8.92 | 7.29 | 7.90 |
| Mid | – | 5.1 | 7.14 | 5.78 | 3.84 |
| Bottom | – | 3.58 | 4.77 | 2.76 | 3.55 |
| 6 | |||||
| Surface | 7.49 | 7.91 | 8.81 | 7.18 | 8.54 |
| Mid | 3.32 | 3.69 | 7.18 | 6.63 | 4.03 |
| Bottom | 3.66 | 3.52 | 5.99 | 6.25 | 3.43 |
| 7 | |||||
| Surface | 4.91 | 9.46 | 10.25 | 6.56 | 8.02 |
| Mid | 4.87 | 2.15 | 8.12 | 6.4 | 5.01 |
| Bottom | 3.57 | 1.71 | 4.54 | 5.85 | 3.53 |
| 8 | |||||
| Surface | 6.37 | 7.53 | 8.4 | 9.33 | 7.86 |
| Mid | 6.86 | 2.74 | 7.48 | 5.45 | 3.72 |
| Bottom | 4.66 | 2.18 | 7.01 | 4.75 | 1.66 |
| 9 | |||||
| Surface | 5.59 | 9.46 | 7.82 | 7.33 | 8.14 |
| Mid | 5.47 | 2.15 | 5.71 | 5.45 | 5.12 |
| Bottom | 6.42 | 1.71 | 4.64 | 4.79 | 2.64 |